
Navigate Salesforce's Debug Logs and Checkpoints for Apex debugging. Understand log messages and checkpoints for efficient problem-solving.
In this piece, we'll delve into the essentials of debugging in Salesforce's Apex with a specific focus on using Debug Logs and Checkpoints. You'll be guided through the process, from understanding the unique challenges of debugging in a multitenant architecture like Salesforce to the practical application of creating debug statements and setting up Trace Flags.
Here are our 5 key takeaways:
“90% of coding is debugging. The other 10% is writing bugs” — @bramcohen
A typical Salesforce log contains a number of things: code execution, debug statements, timestamps and any governor limits you may be running into.
The simplest way to get started with logging in Salesforce is to add a debug statement to your code. We’ll use the default Apex Trigger code example found in the Salesforce docs on Writing Your First Apex Class and Trigger.
In the tutorial, we create a custom objects called a Book with a custom field called Price:
public class HelloWorld {
public static void applyDiscount(Book__c[] books) {
for (Book__c book : books) {
book.Price__c *= 0.9;
}
}
}
We have a Trigger which applies a discount of 10% whenever you add a new Book:
trigger HelloWorldTrigger on Book__c (before insert) {
Book__c[] books = Trigger.new;
HelloWorld.applyDiscount(books);
}
The easiest thing is to add a System.debug() statement to the trigger like so:
trigger HelloWorldTrigger on Book__c (before insert) {
Book__c[] books = Trigger.new;
HelloWorld.applyDiscount(books);
System.debug('my message that I want to show up in the logs');
}
If I add a new Book, the Salesforce Debug Logs will display the statement that I added. Kind of like throwing a print statement in Python. But where do I see this log?
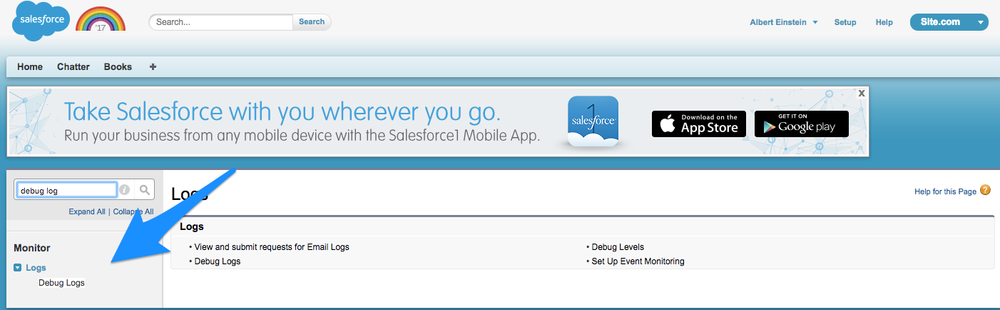
Next, setup a new Trace Flag. A Trace Flag tells Salesforce to log any activity caused by a particular user.
You will also need to set a Debug Level. There are number of debug levels:
LoggingLevel.NONE
LoggingLevel.ERROR
LoggingLevel.WARN
LoggingLevel.INFO
LoggingLevel.FINE
LoggingLevel.FINER
LoggingLevel.FINEST
Salesforce logs are capped at 2MB so you may need to tinker a bit with your log levels to make sure you stay under that limit.
Be sure to note that your Trace has an expiration date and time. Check this if your logs mysteriously stop showing up after a few minutes of debugging.
Now run your trigger again by creating a new Book. When you return to the Debug Logs you should now see logs.
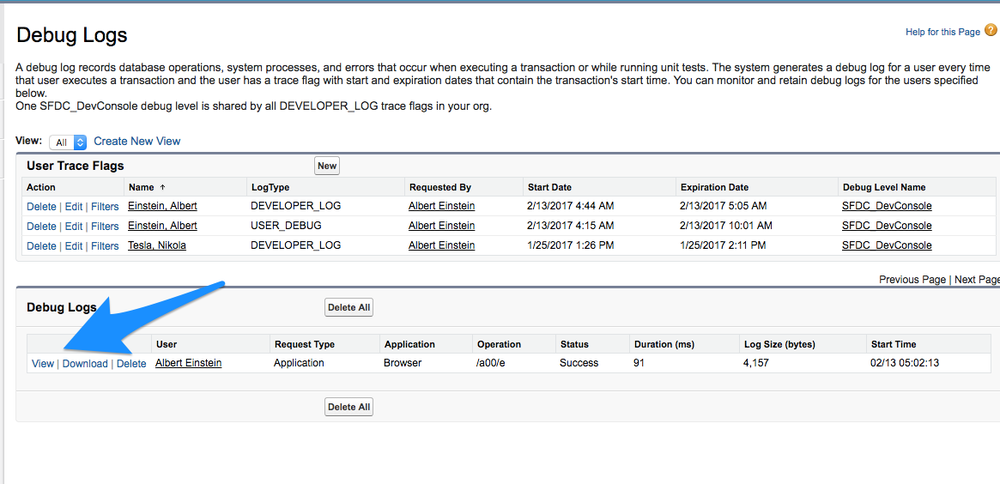
Once you are here, you now have log output you can look at.
What's in a log? The debug log has several useful elements:
39.0 APEX_CODE,FINEST;APEX_PROFILING,INFO; CALLOUT,INFO;DB,INFO;SYSTEM,DEBUG;VALIDATION,INFO; VISUALFORCE,INFO;WAVE,INFO;WORKFLOW,INFO
05:02:13.0 (218671)|USER_INFO|[EXTERNAL]|00541000001zI0K|jack+albert@bluecanvas.io|Pacific Standard Time|GMT-08:00
05:02:13.0 (257361)|EXECUTION_STARTED
05:02:13.0 (262162)|CODE_UNIT_STARTED|[EXTERNAL]|TRIGGERS
05:02:13.0 (300519)|CODE_UNIT_STARTED|[EXTERNAL]|01q41000001JanC|HelloWorldTrigger on Book trigger event BeforeInsert for [new]
05:02:13.0 (359311)|HEAP_ALLOCATE|[EXTERNAL]|Bytes:8
05:02:13.0 (764600)|HEAP_ALLOCATE|[72]|Bytes:3
05:02:13.0 (834010)|HEAP_ALLOCATE|[77]|Bytes:152
05:02:13.0 (857019)|HEAP_ALLOCATE|[342]|Bytes:408
05:02:13.0 (875943)|HEAP_ALLOCATE|[355]|Bytes:408
05:02:13.0 (894176)|HEAP_ALLOCATE|[467]|Bytes:48
05:02:13.0 (927154)|HEAP_ALLOCATE|[139]|Bytes:6
05:02:13.0 (945255)|HEAP_ALLOCATE|[EXTERNAL]|Bytes:1
05:02:13.0 (1072442)|HEAP_ALLOCATE|[EXTERNAL]|Bytes:8
05:02:13.0 (1086106)|VARIABLE_SCOPE_BEGIN|[1]|this|HelloWorldTrigger|true|false
05:02:13.0 (1139970)|VARIABLE_ASSIGNMENT|[1]|this|{}|0x612fbadc
05:02:13.0 (1191038)|HEAP_ALLOCATE|[EXTERNAL]|Bytes:8
05:02:13.0 (1198395)|VARIABLE_SCOPE_BEGIN|[1]|this|HelloWorldTrigger|true|false
05:02:13.0 (1214030)|VARIABLE_ASSIGNMENT|[1]|this|{}|0x612fbadc
05:02:13.0 (1219830)|STATEMENT_EXECUTE|[1]
05:02:13.0 (1221599)|STATEMENT_EXECUTE|[2]
05:02:13.0 (1258733)|HEAP_ALLOCATE|[50]|Bytes:5
05:02:13.0 (1285175)|HEAP_ALLOCATE|[56]|Bytes:5
05:02:13.0 (1293649)|HEAP_ALLOCATE|[64]|Bytes:7
05:02:13.0 (1684574)|VARIABLE_ASSIGNMENT|[2]|this.books|[{"IsDeleted":false,"OwnerId":"00541000001zI0KAAU",
"Price__c":100.00,
"Name":"Blog Book Test 1"}]|0x612fbadc
05:02:13.0 (1690698)|STATEMENT_EXECUTE|[3]
05:02:13.0 (3258094)|HEAP_ALLOCATE|[3]|Bytes:1
05:02:13.0 (3277447)|METHOD_ENTRY|[1]|01p4100000HR623|HelloWorld.HelloWorld()
05:02:13.0 (3281108)|STATEMENT_EXECUTE|[1]
05:02:13.0 (3286028)|STATEMENT_EXECUTE|[1]
05:02:13.0 (3291206)|METHOD_EXIT|[1]|HelloWorld
05:02:13.0 (3321524)|METHOD_ENTRY|[3]|01p4100000HR623|HelloWorld.applyDiscount(List<Book__c>)
05:02:13.0 (3350205)|VARIABLE_SCOPE_BEGIN|[2]|books|List<Book__c>|true|false
05:02:13.0 (3484434)|VARIABLE_ASSIGNMENT|[2]|books|[{"IsDeleted":false,"OwnerId":"00541000001zI0KAAU","Price__c":
100.00,
"Name":"Blog Book Test 1"}]|0x2f08a20a
05:02:13.0 (3493612)|STATEMENT_EXECUTE|[2]
05:02:13.0 (3729368)|HEAP_ALLOCATE|[3]|Bytes:5
05:02:13.0 (3757183)|HEAP_ALLOCATE|[3]|Bytes:4
05:02:13.0 (3766245)|VARIABLE_SCOPE_BEGIN|[3]|b|Book__c|true|false
05:02:13.0 (3869071)|VARIABLE_ASSIGNMENT|[3]|b|{"IsDeleted":false,"OwnerId":"00541000001zI0KAAU",
"Price__c":100.00,
"Name":"Blog Book Test 1"}|0x6857411d
05:02:13.0 (3874120)|STATEMENT_EXECUTE|[3]
05:02:13.0 (3875268)|STATEMENT_EXECUTE|[4]
05:02:13.0 (3917921)|HEAP_ALLOCATE|[4]|Bytes:3
05:02:13.0 (3940194)|HEAP_ALLOCATE|[4]|Bytes:28
05:02:13.0 (4002038)|HEAP_ALLOCATE|[4]|Bytes:28
05:02:13.0 (4194737)|VARIABLE_ASSIGNMENT|[4]|this.Price__c|90.000|0x6857411d
05:02:13.0 (4218164)|HEAP_ALLOCATE|[3]|Bytes:5
05:02:13.0 (4239381)|VARIABLE_ASSIGNMENT|[3]|b|null|
05:02:13.0 (4249224)|METHOD_EXIT|[3]|01p4100000HR623|HelloWorld.applyDiscount(List<Book__c>)
05:02:13.0 (4254931)|STATEMENT_EXECUTE|[4]
05:02:13.0 (4259392)|HEAP_ALLOCATE|[4]|Bytes:45
05:02:13.0 (4309898)|USER_DEBUG|[4]|DEBUG|my message that I want to show up in the logs
05:02:13.4 (4323385)|CUMULATIVE_LIMIT_USAGE
05:02:13.4 (4323385)|LIMIT_USAGE_FOR_NS|(default)|
Number of SOQL queries: 0 out of 100
Number of query rows: 0 out of 50000
Number of SOSL queries: 0 out of 20
Number of DML statements: 0 out of 150
Number of DML rows: 0 out of 10000
Maximum CPU time: 0 out of 10000
Maximum heap size: 0 out of 6000000
Number of callouts: 0 out of 100
Number of Email Invocations: 0 out of 10
Number of future calls: 0 out of 50
Number of queueable jobs added to the queue: 0 out of 50
Number of Mobile Apex push calls: 0 out of 10
05:02:13.4 (4323385)|CUMULATIVE_LIMIT_USAGE_END
05:02:13.0 (7801949)|CODE_UNIT_FINISHED|HelloWorldTrigger on Book trigger event BeforeInsert for [new]
05:02:13.0 (56862492)|CODE_UNIT_FINISHED|TRIGGERS
05:02:13.0 (56876928)|EXECUTION_FINISHED
The first line is the Header. It provides version info and the log levels we set for the various logging categories. It’s here that you can see that your Apex Code log level is set to Finest while Validation is set to Info.
39.0 APEX_CODE,FINEST;APEX_PROFILING,INFO; CALLOUT,INFO;DB,INFO;SYSTEM,DEBUG;VALIDATION,INFO; VISUALFORCE,INFO;WAVE,INFO;WORKFLOW,INFO
The next line provides user info:
USER_INFO|[EXTERNAL]|00541000001zI0K|jack+albert@bluecanvas.io|Pacific Standard Time|GMT-08:00
This user info includes the username of the user which caused the log generating action. It also includes the timezone of that user. (Bryan mentions in his talk a time where knowing timezone information was crucial in squashing a bug!)
Next you can see that execution units have started. An execution unit contains everything happens during a transaction. EXECUTION_STARTED and EXECUTION_FINISHED show the start and end of an execution unit.
05:02:13.0 (257361)|EXECUTION_STARTED
05:02:13.0 (262162)|CODE_UNIT_STARTED|[EXTERNAL]|TRIGGERS
05:02:13.0 (300519)|CODE_UNIT_STARTED|[EXTERNAL]|01q41000001JanC|HelloWorldTrigger on Book trigger event BeforeInsert for [new]
Within transactions you have code units. Code units are “discrete unit of work within a transaction.” Apex classes, triggers, and validation rules are all examples of a code unit.
Each transaction and code unit includes a timestamp and the number of nanoseconds that have transpired since the transaction started (this is the long number in parenthesis after the time stamp). This can be useful for debugging performance issues.
At the very end you get cumulative profiling information including SOQL queries, CPU time and heap size:
05:02:13.4 (4323385)|LIMIT_USAGE_FOR_NS|(default)|
Number of SOQL queries: 0 out of 100
Number of query rows: 0 out of 50000
Number of SOSL queries: 0 out of 20
Number of DML statements: 0 out of 150
Number of DML rows: 0 out of 10000
Maximum CPU time: 0 out of 10000
Maximum heap size: 0 out of 6000000
Number of callouts: 0 out of 100
Number of Email Invocations: 0 out of 10
Number of future calls: 0 out of 50
Number of queueable jobs added to the queue: 0 out of 50
Number of Mobile Apex push calls: 0 out of 10
05:02:13.4 (4323385)|CUMULATIVE_LIMIT_USAGE_END
05:02:13.0 (7801949)|CODE_UNIT_FINISHED|HelloWorldTrigger on Book trigger event BeforeInsert for [new]
05:02:13.0 (56862492)|CODE_UNIT_FINISHED|TRIGGERS
05:02:13.0 (56876928)|EXECUTION_FINISHED
Salesforce has more docs on debug logs which are worth reading.
You can also use the developer console for debugging. Salesforce has a concept called “checkpoints”.
With checkpoints, you can “investigate the objects in memory at a specific point of execution and see the other objects with references to them.” You can get a dump of variable information at the time of that checkpoint.
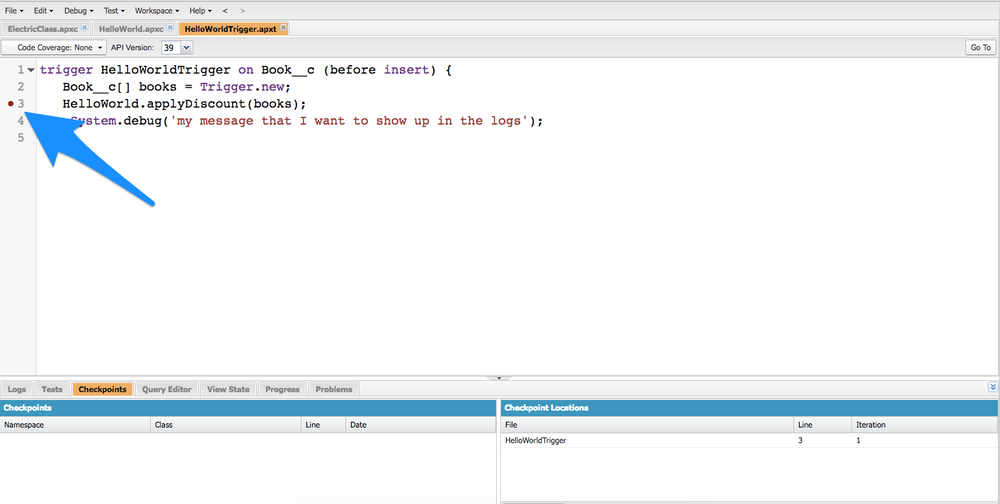
If you run your trigger again (in our example by adding a new Book) you can now examine the variable data at that moment.
Here we can see that the title of the book is Don Quixote and the price is $30 at the point of the checkpoint:

You can set up to 5 checkpoints at once. Using multiple checkpoints can help you figure out where exactly variable information changes. Heap information is also available on checkpoints.
To learn more about checkpoints, check out this documentation.
There are also some paid solutions that provide advanced debugging solutions.
Salesforce sells Advanced Debugger which extends the Force.com IDE plug-in for Eclipse. It allows you to set breakpoints for Apex classes and triggers, view variables, see the call stack, interact with global classes, output results to the Console, and much more.

Some of the paid IDEs like Illuminated Cloud offer an advanced Apex Debugger as a part of their platform as well.
As always, the Salesforce community has some amazing resources about Apex debugging. As mentioned above, Appirio’s Bryan Leboff gave a great talk on best practices for debugging Apex which you can watch the full video here:
Jitendra Zaa’s blog has a number of great tutorials and posts about debugging, including videos.
As we've seen throughout this article, Salesforce's Apex presents unique challenges for debugging. That said, armed with the right knowledge and tools, we believe these challenges can be surmounted effectively!
By getting more familiar with tools like Debug Logs and Checkpoints, you'll gain critical insights into the execution of code units and transactions involved in your application. You'll also uncover profiling information such as SOQL queries, CPU time, and heap size. These are invaluable for troubleshooting your Apex code and enhancing its efficiency. As you fix your code, you can then use DevOps tools like Blue Canvas to smoothly deploy patches to your Salesforce orgs (we offer a free 14-day trial, sign up here).
It's now time to put theory into practice! Remember that a robust debugging process is key to writing efficient, error-free code. Don't let bugs slow you down - empower your development with the right debugging tools and speed up your deployment cycle together with Blue Canvas. 🚀
-------------
What are Debug Logs in Salesforce?
How can I add debug statements to my Apex code for logging purposes?
How can I view Debug Logs in Salesforce?
How can I set up Trace Flags for logging activity by a specific user?
Why is it important to keep track of the expiration date and time of Trace Flags?
What information can I find in Salesforce debug logs?
Are there any paid solutions for advanced debugging in Salesforce?
Are there any recommended resources for learning more about debugging in Salesforce?


.png)